
Coca-Cola vs. Toyota: which has more plants around the world?
- Jake Lee
- Jan 28, 2022
- 3 min read
Updated: Feb 13, 2022
Only 23 percent, a minority of international trade, occurs between adjacent countries: those with a land border, like the US and Canada. 90 percent of this trade goes by truck, train, or pipeline, while airfare accounts for the other ten percent. The remaining 77 percent of international trade occurs between non-adjacent countries. For these, all trade moves by ocean and air. Overall, about 80 percent of international trade goes by plane or ship, and the direct spending on the global sea and air freight account for one percent of world Gross Domestic Product (GDP) (i.e. just under $1 trillion per year).
Despite that transportation massively contributes to the world GDP, transportation is still regarded as a ‘friction cost’ associated with transaction costs, which gets in the way of trade. It is straightforward that as transportation costs fall, more trade occurs. Thus, this article will explore how international trade volume increased following the reduction of world transportation costs in the respect of air freight.
Air cargo first took flight in the early 1910s but had not been used frequently at that time due to its notoriously high cost. However, the international volume of air freight has increased gradually from 41 million to 66.2 million metric tonnes according to Figure 1.
There are two key reasons why air freights is more commonly used now. Firstly, the price of air freights has gone down enormously. According to <Figure 2>, air freight price fell from $3.87 per ton-km in 1955 to $0.30 in 2004 after adjusting for inflation. From 1955 to 1972, the price declined by 8.1 percent per year, and from 1972 to 2003, it declined by 3.5 percent per year. Furthermore, this price reduction can be simply explained by greater competition in the market and simultaneous technological innovation. Secondly, the marginal cost has decreased. As technology improves and becomes more sophisticated, the price of goods we trade has increased compared to the weight of the goods.
To illustrate, suppose Korea imports whiskey from the UK — whiskey A and B each costs £10 and £100 per bottle, respectively. In this circumstance, the airfare, a fixed cost for both whiskeys at £5, has increased final price by 50 percent to £15 for whiskey A, whereas only by 5 percent to £105 for whiskey B. Since only the final price affects consumers' demand, it can be seen that the transportation cost decreases marginally as the price of goods gradually increases over time. As a result, air freight costs fall to negligible levels, which leads to an increase in air trade, as described above.
In this sense, we can think of a riddle: Coca-Cola or Toyota, which has more plants around the world? At a glance, the answer seems complicated and enigmatic However, we can deduce it through backward induction. Firstly consider the factors of production for each company. Toyota’s manufacturing process requires machinery, steel core, and more, which are relatively more expensive, compared to Coca-Cola’s water and concentrate, which are relatively cheaper.
Then considering air freights, we can deduce that Coca-Cola will not deliver their final products by air freight in order to avoid an increase in the cost of production. Conversely, Toyota would rather send their final products by air because the additional transportation cost is imperceptible when added to the final price of a car.
Eventually, we can conclude that for Coca-Cola, using water from the region and importing only important concentrates will significantly reduce the cost, while for Toyota, producing final products at one factory and exporting them to stores around the world will further reduce the cost. Thus, the number of Coca-Cola's plants are much larger than Toyota's —Toyota manufactures cars in only 23 locations worldwide while Coca-Cola has over 900 bottling plants around the world.
Thus, from the example of Coca-Cola and Toyota, we can observe that the reduced marginal cost plays a critical factor in increasing the international volume of air freight and reduced transportation costs.
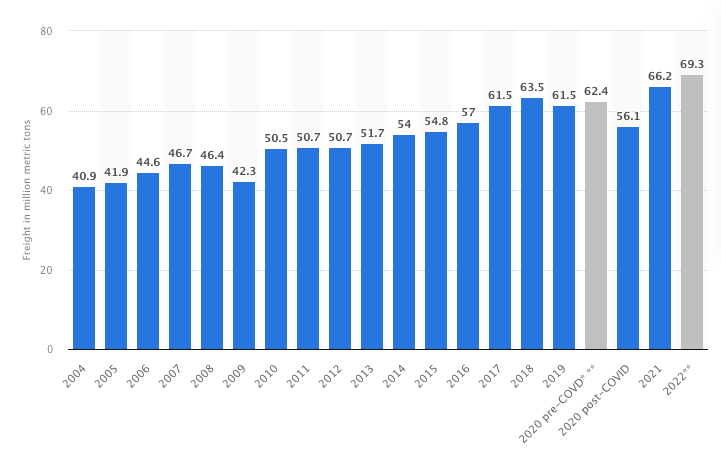
Figure 1, Worldwide air freight traffic from 2004 to 2022

Figure 2, the cost of air freight per one-kilometre
References
- Hummels, David. 2007. "Transportation Costs and International Trade in the Second Era of Globalization." Journal of Economic Perspectives,


Comments