
Low interest rate and the Global Savings Glut
- Sarah Baek
- Dec 3, 2021
- 3 min read

Updated: Dec 6, 2021
*Although the discussion of this topic involves heavy quantitative analysis and advanced economics knowledge, I tried to explain what I understood with simple language.*
In 2005, Ben Bernanke, former Chairman of the Federal Reserve, coined the term “Global Savings Glut (GSG), expressing concern over the impact of “significant increase in the global supply of savings” on the monetary policy of the US. The US longer-term interest rates from 2003 to 2007 suggested that desired saving exceeds desired investment over the time period.
There is a range of causes that led to the formation of this hypothesis, including the dollar’s reserve currency role, the Asian Financial Crisis in 1997 that increased Eastern countries’ demand for foreign reserves, increased demand of cash for corporate balance sheets, increases in oil prices that lead to current account surplus of oil-exporting countries, and Central Bank interventions with the Sovereign Wealth Funds.
Rather than discussing in depth these causes, this article will examine the cause and effect relationship between the Global Savings Glut and low interest rate.
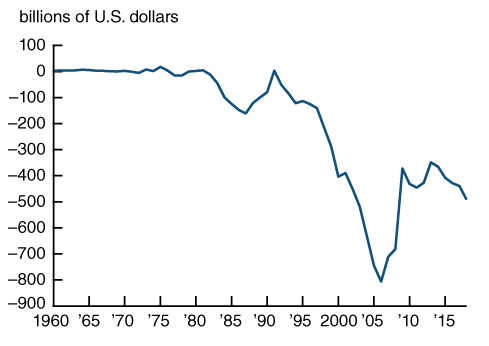
Figure 1: Annual US current account, 1960-2018. Source: US Bureau of Economic Analysis
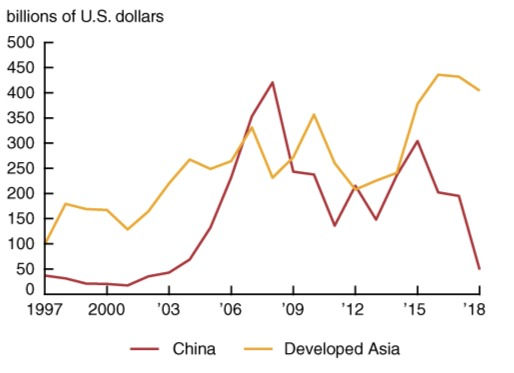
Figure 2: Saving and Investment as a share of GDP in China, 2000-2008.
The US current account behaviour from the early 1990s motivated the GSG hypothesis. While roughly in balance in 1992 to a deficit of $800 billion in 2006, the worsening US current account deficit [1] combined with movement towards larger surpluses in source countries[2], suggest a global imbalance between saving and investment developed from the initial interest rate. In 2016, the world trade imbalance accounted for 1.5 percent of world GDP.
The second observation to analyse this theory is by directly examining the saving and investment balance.
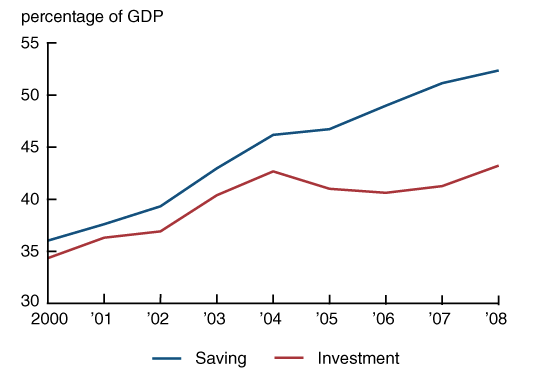
Figure 3: Saving and Investment as a share of GDP in China, 2000-2008.
The above graph shows that China’s saving and investment as a percentage of Gross Domestic Product (GDP) diverge from 2004. Assuming this trend is true in the rest of the world, the extent of the fall in the global investment schedule and the increase in the global savings schedule shown in Figure 4 can be regarded as valid.

Figure 4: World saving and investment
Generally, the equilibrium quantity of world saving and investment is decided by the relative shifts of the savings and investment schedules. From previous data, the above diagram shows how an outward shift of the world supply schedule of saving (S) and an inward supply of the world demand schedule for investment (I) result in a lower interest rate.
The previous two observations on current account deficits and the balance between savings and investment suggest a declining trend of interest rate.

Figure 5: Ten-year Treasury Inflation-Projected Securities (TIPS) yield and expected ten-year real interest rate, January 1992-November 2019
Notes: Monthly averages are used for each data point of both series.
The global imbalances from the first observation suggest that a drop in long-term interest rates is required to re-equilibrate the US and the global economy. Also, if GSG’s countries current account surpluses resulted from an exogenous increase in saving and/or decrease in domestic investment, we can draw a conclusion — excess saving in the East which is an exogenous component to developments in the US, lead to depressed world real interest rates large current account deficits in the US.
Furthermore, excess saving essentially means weak investment. Weakening investment is shown repeatedly by GSG countries — indeed, investment as a portion of GDP declined over the past 40 years. Interest rates will continue to be lowered during this time period in order to boost investment.

Figure 6: Global Saving and Investment as a Share of World GDP
GSG is only a hypothesis, afterall. Taylor (2009) argues that both world saving and investment as a fraction of world GDP fell by several percentage points over the period 1970-2004. This is shown in figure 6 above. World savings and investment curves move together, almost without any differences, which Taylor uses this observation to argue that there was no global savings glut at all.
With abundant economics knowledge and research available, it is up to an individual to learn and inquire what one thinks is true.
References
Notes
[1] Bernanke assumed that the world can be explained by the US and the rest.
Since the global current accounts should equal to zero,
NXus + NXrest = 0 (1) is assumed.
Thus, NXrest = -NXUS (2)
Equation (2) can be rewritten as: NX = Savings - Investment
Thus, Srest - Irest = - NXus
If savings of the rest of the world increases, foreign investors’ capital and money flows into the US, increasing the Net Cash Flows. Thus -NXUS becomes larger, indicating a higher US trade deficit.
[2] GSG countries; developed economies in Asia and non-western countries


Comments